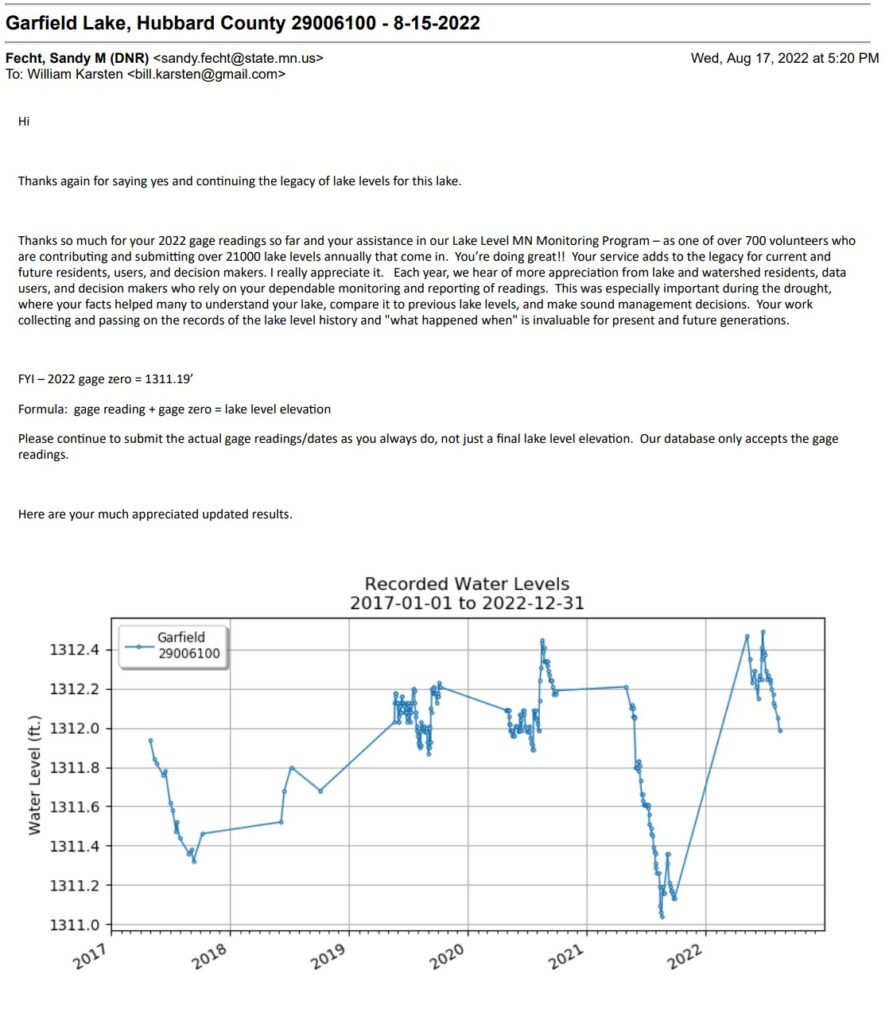
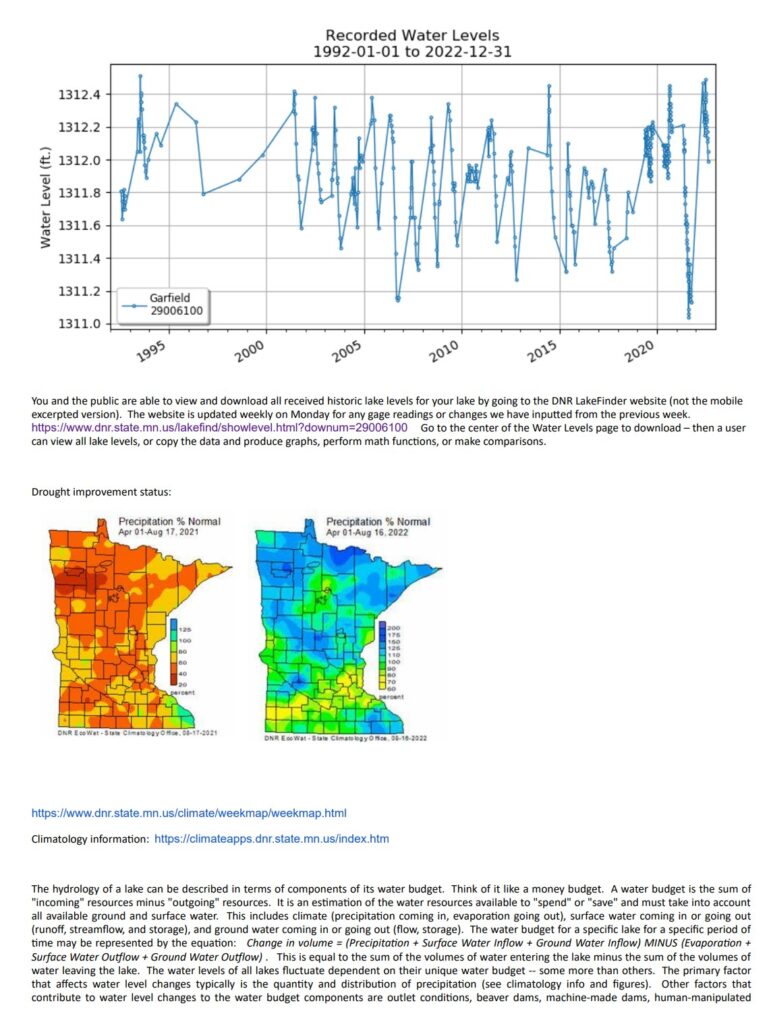
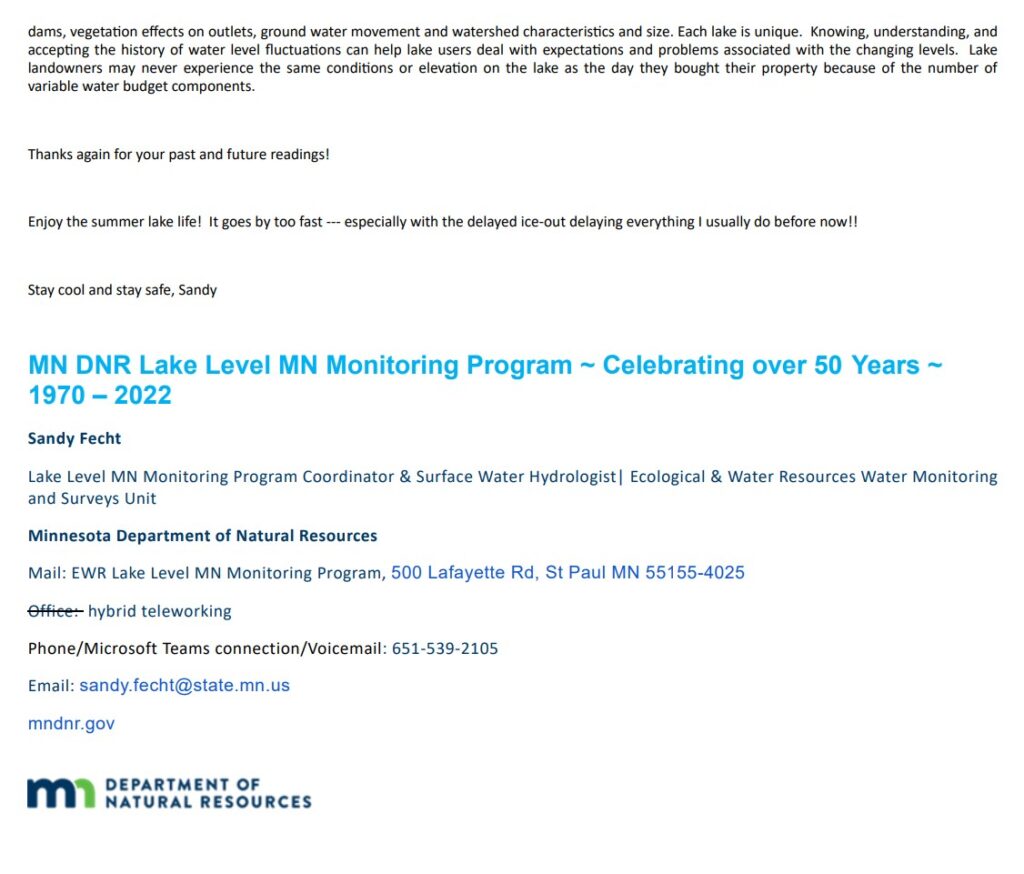


I have taken over the reporting of Lake Levels to the MN DNR for 2022. I report weekly the lake level and rainfall amounts I record each week to the DNR, who has kept records of the lake level going back to 1992.
These records can be found on the DNR website here.
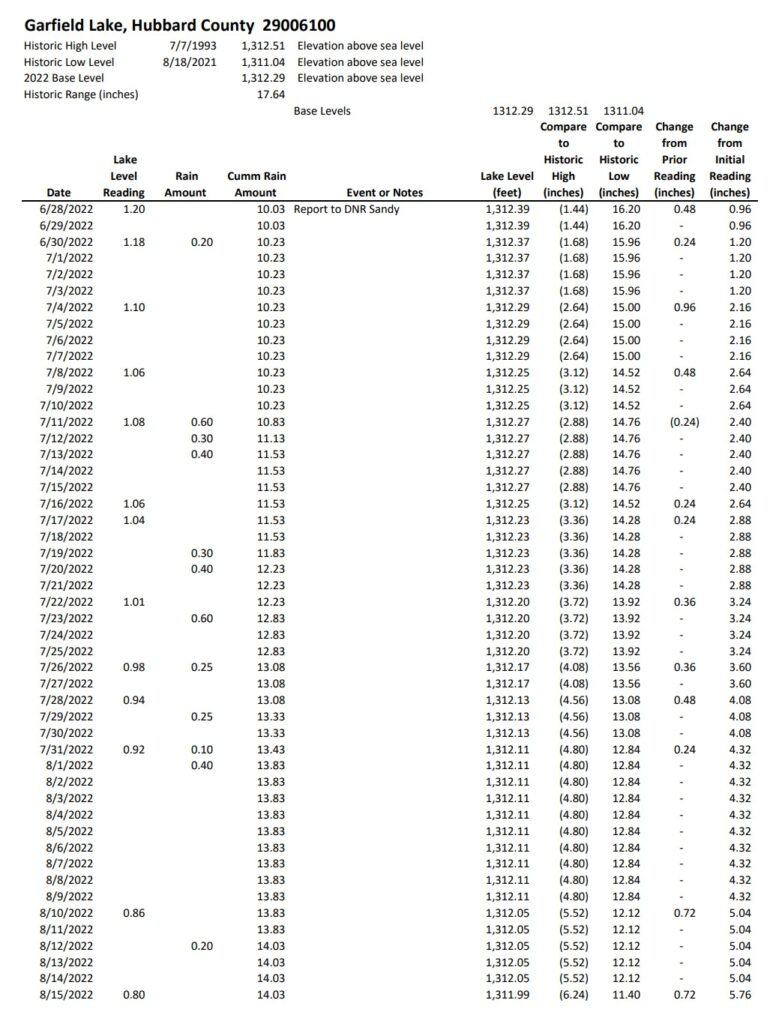
Here are records for the current year, 2022:

Here is some information on the Trophic State Index which summaries a lake’s nutrient richness.
Trophic State Index as defined by Wikipedia:
The Trophic State Index (TSI) is a classification system designed to rate water bodies based on the amount of biological productivity they sustain.[1] Although the term “trophic index” is commonly applied to lakes, any surface water body may be indexed.
The TSI of a water body is rated on a scale from zero to one hundred.[1] Under the TSI scale, water bodies may be defined as:[1]
The quantities of nitrogen, phosphorus, and other biologically useful nutrients are the primary determinants of a water body’s TSI. Nutrients such as nitrogen and phosphorus tend to be limiting resources in standing water bodies, so increased concentrations tend to result in increased plant growth, followed by corollary increases in subsequent trophic levels.[a] Consequently, trophic index may sometimes be used to make a rough estimate of biological condition of water bodies.[2]
Garfield Lake Data:
Nutrient richness ranges from clear lakes low in nutrients to green lakes with high nutrients . 0 is clear to 90 which is very green
Garfield Lake is at 42
Lakes in the same eco-region range 38-45
Chlorophylla:
Garfield is at 52 parts per billion
Lakes in the same eco-region ranges 44-53
Total phosphorus:
Garfield is at 42
Lakes in the same eco-region ranges 42-52
Lake transparency for Garfield’s trend line is 11-13 feet
Record of lake levels for Garfield 2009 -2018
Lowest September 2013 – 1311.2 feet above sea level
Highest August 2014 – 1312.4 feet above sea level
So the range is 1.2 feet from highest to lowest water level
Mark Warisch has volunteered with the MN DNR to monitor the lake water levels. He has obtained the following chart showing the history of the water levels:
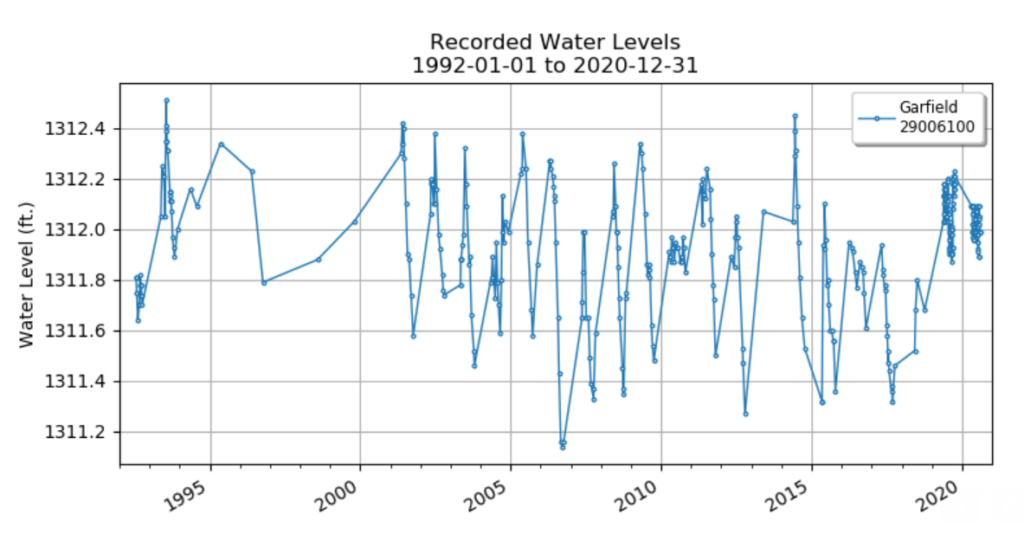
The vertical axis is the feet above sea level. Please note the water level has historically only varied by about 1 foot.